The heatwave that never was
24 Aug 2022Around a month ago, the UK recorded temperatures of over 40°C for the first time - and over a remarkably large area. A few features of the heatwave struck me at the time: its unprecedented nature; how well-forecast it was; how seriously it was being taken in a decent chunk of the media; and how much of the discussion about it was framed about the unequivocal influence that human greenhouse gas emissions had on it. A couple of weeks prior to the peak of the heat, Simon Lee wrote an excellent blog post that covers a lot of what I’d say about these features, so that comes as recommended (though hopefully not essential) reading. In this post, I’m going to explore the question of: ‘could an event like this have plausibly happened in the past?’ And to do that, I’m taking you back to 2001…
July 1, 2001*
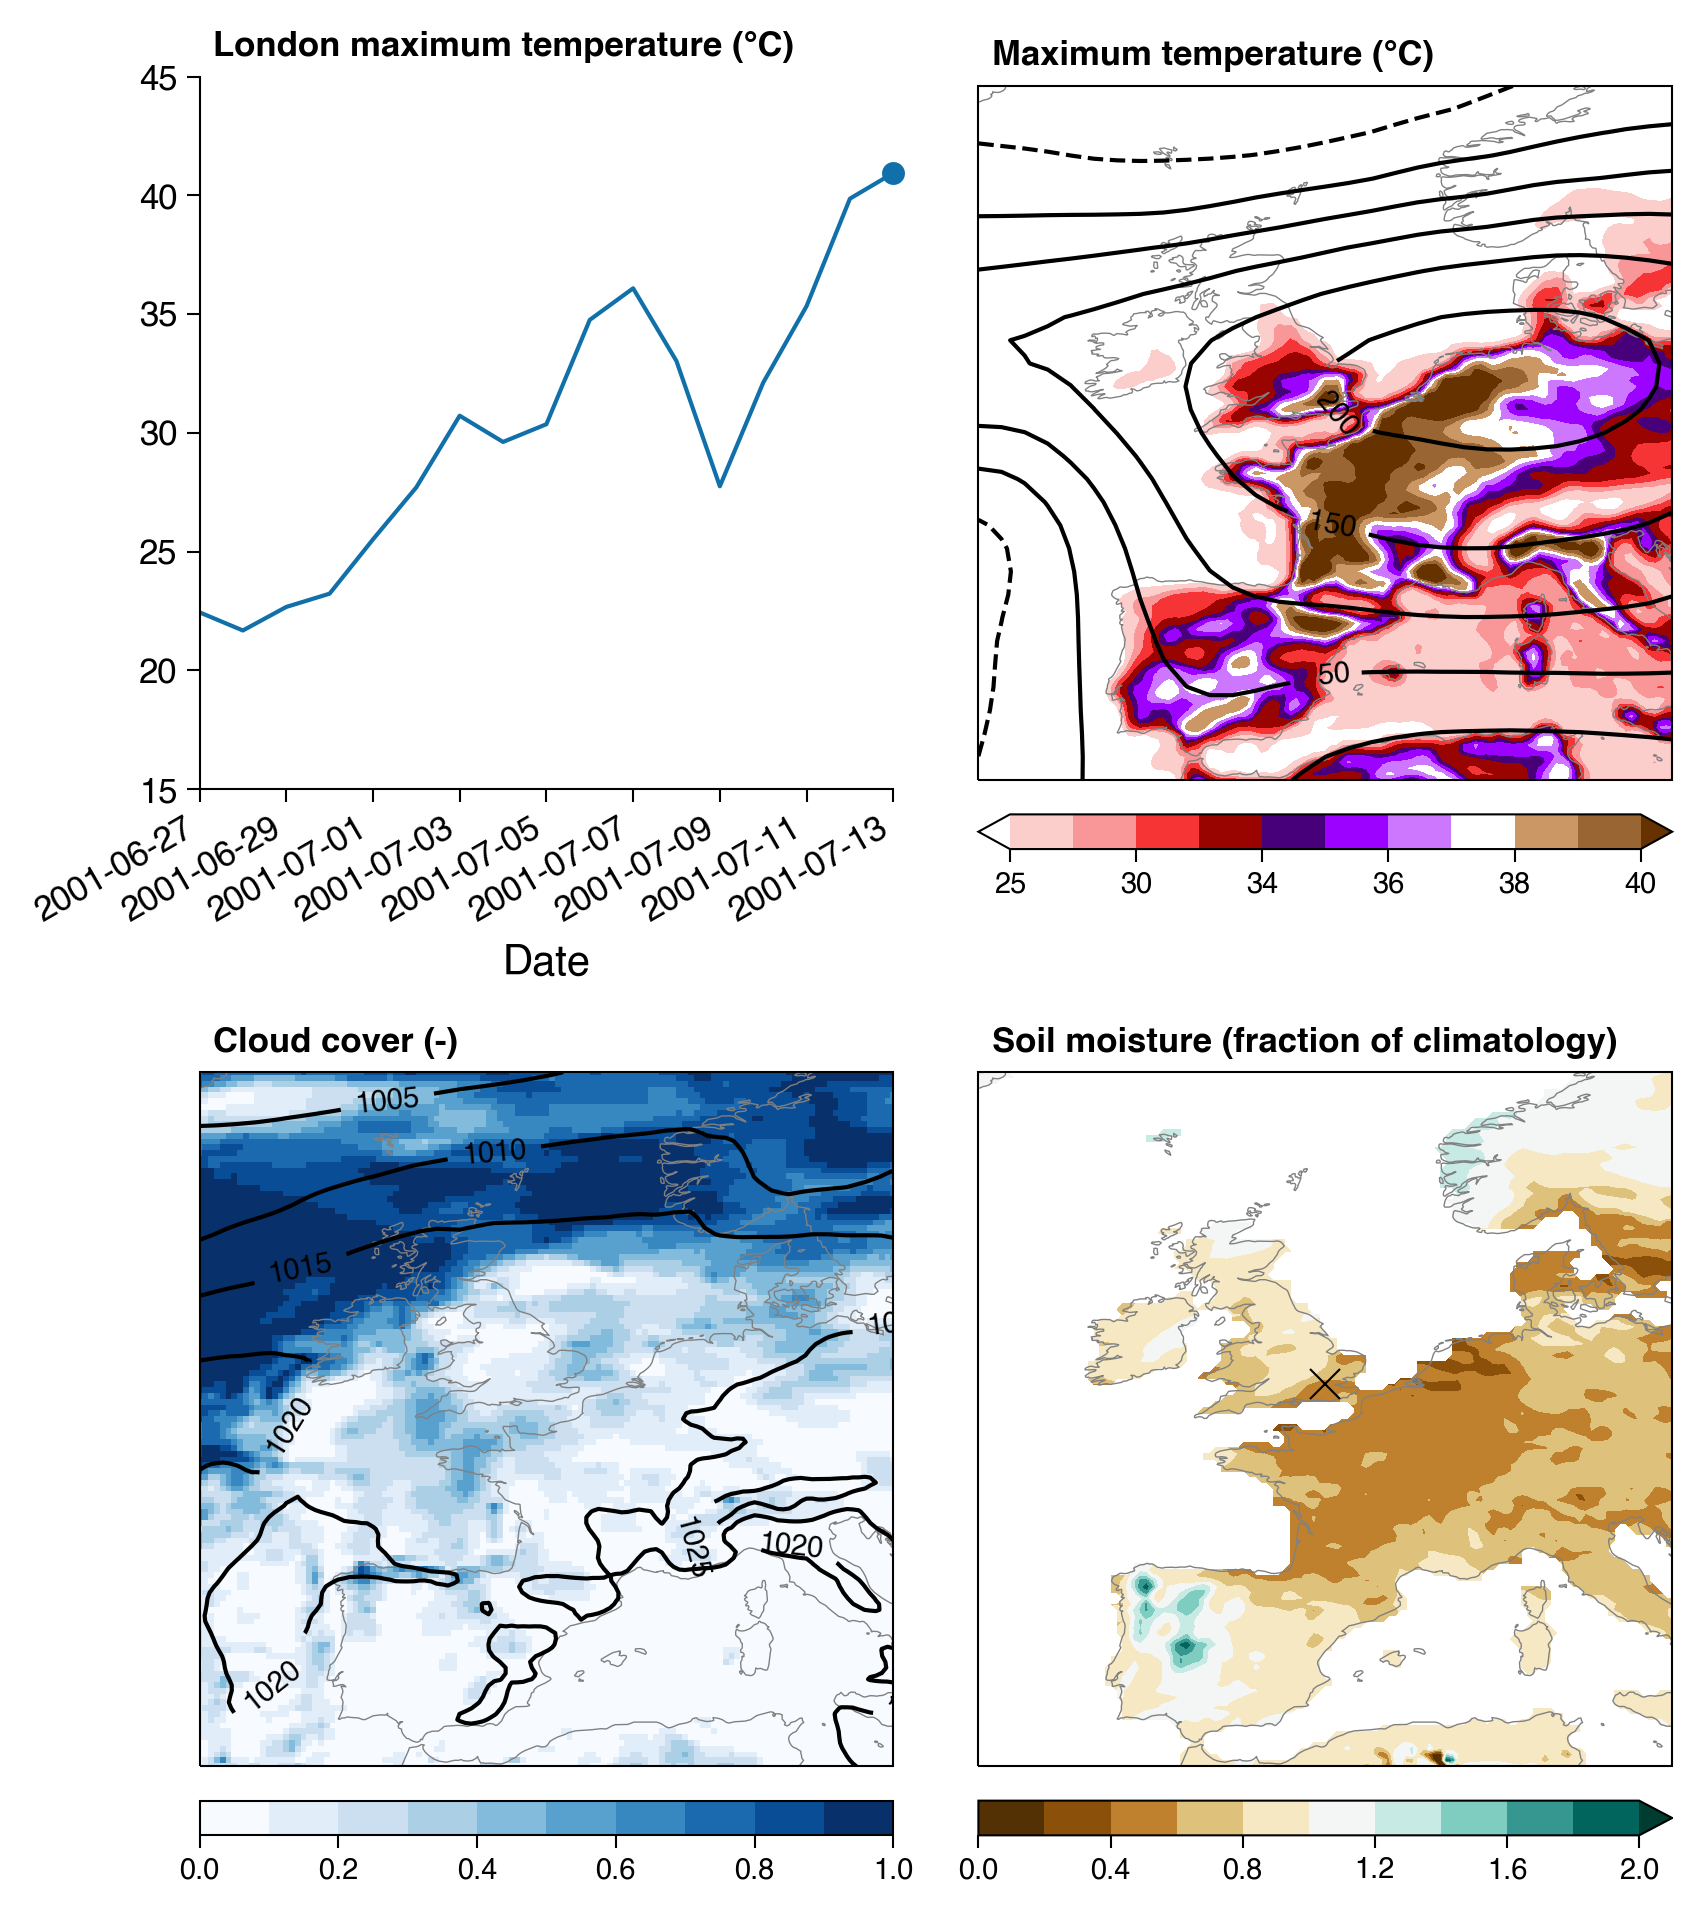
Labour has just won a second term in office with a landslide majority. Tim Henman is looking strong at Wimbledon (come on Tim!). The weather, having been fairly unremarkable thus far over the summer, is starting to look like it might heat up. A ‘dome’ of high pressure / thicker troposphere has developed near the UK, and (top layer, specifically 0-7cm) soil moisture anomalies are relatively low. The temperature in Spain is approaching the high 30s in some locations, but further North it remains fairly ordinary.
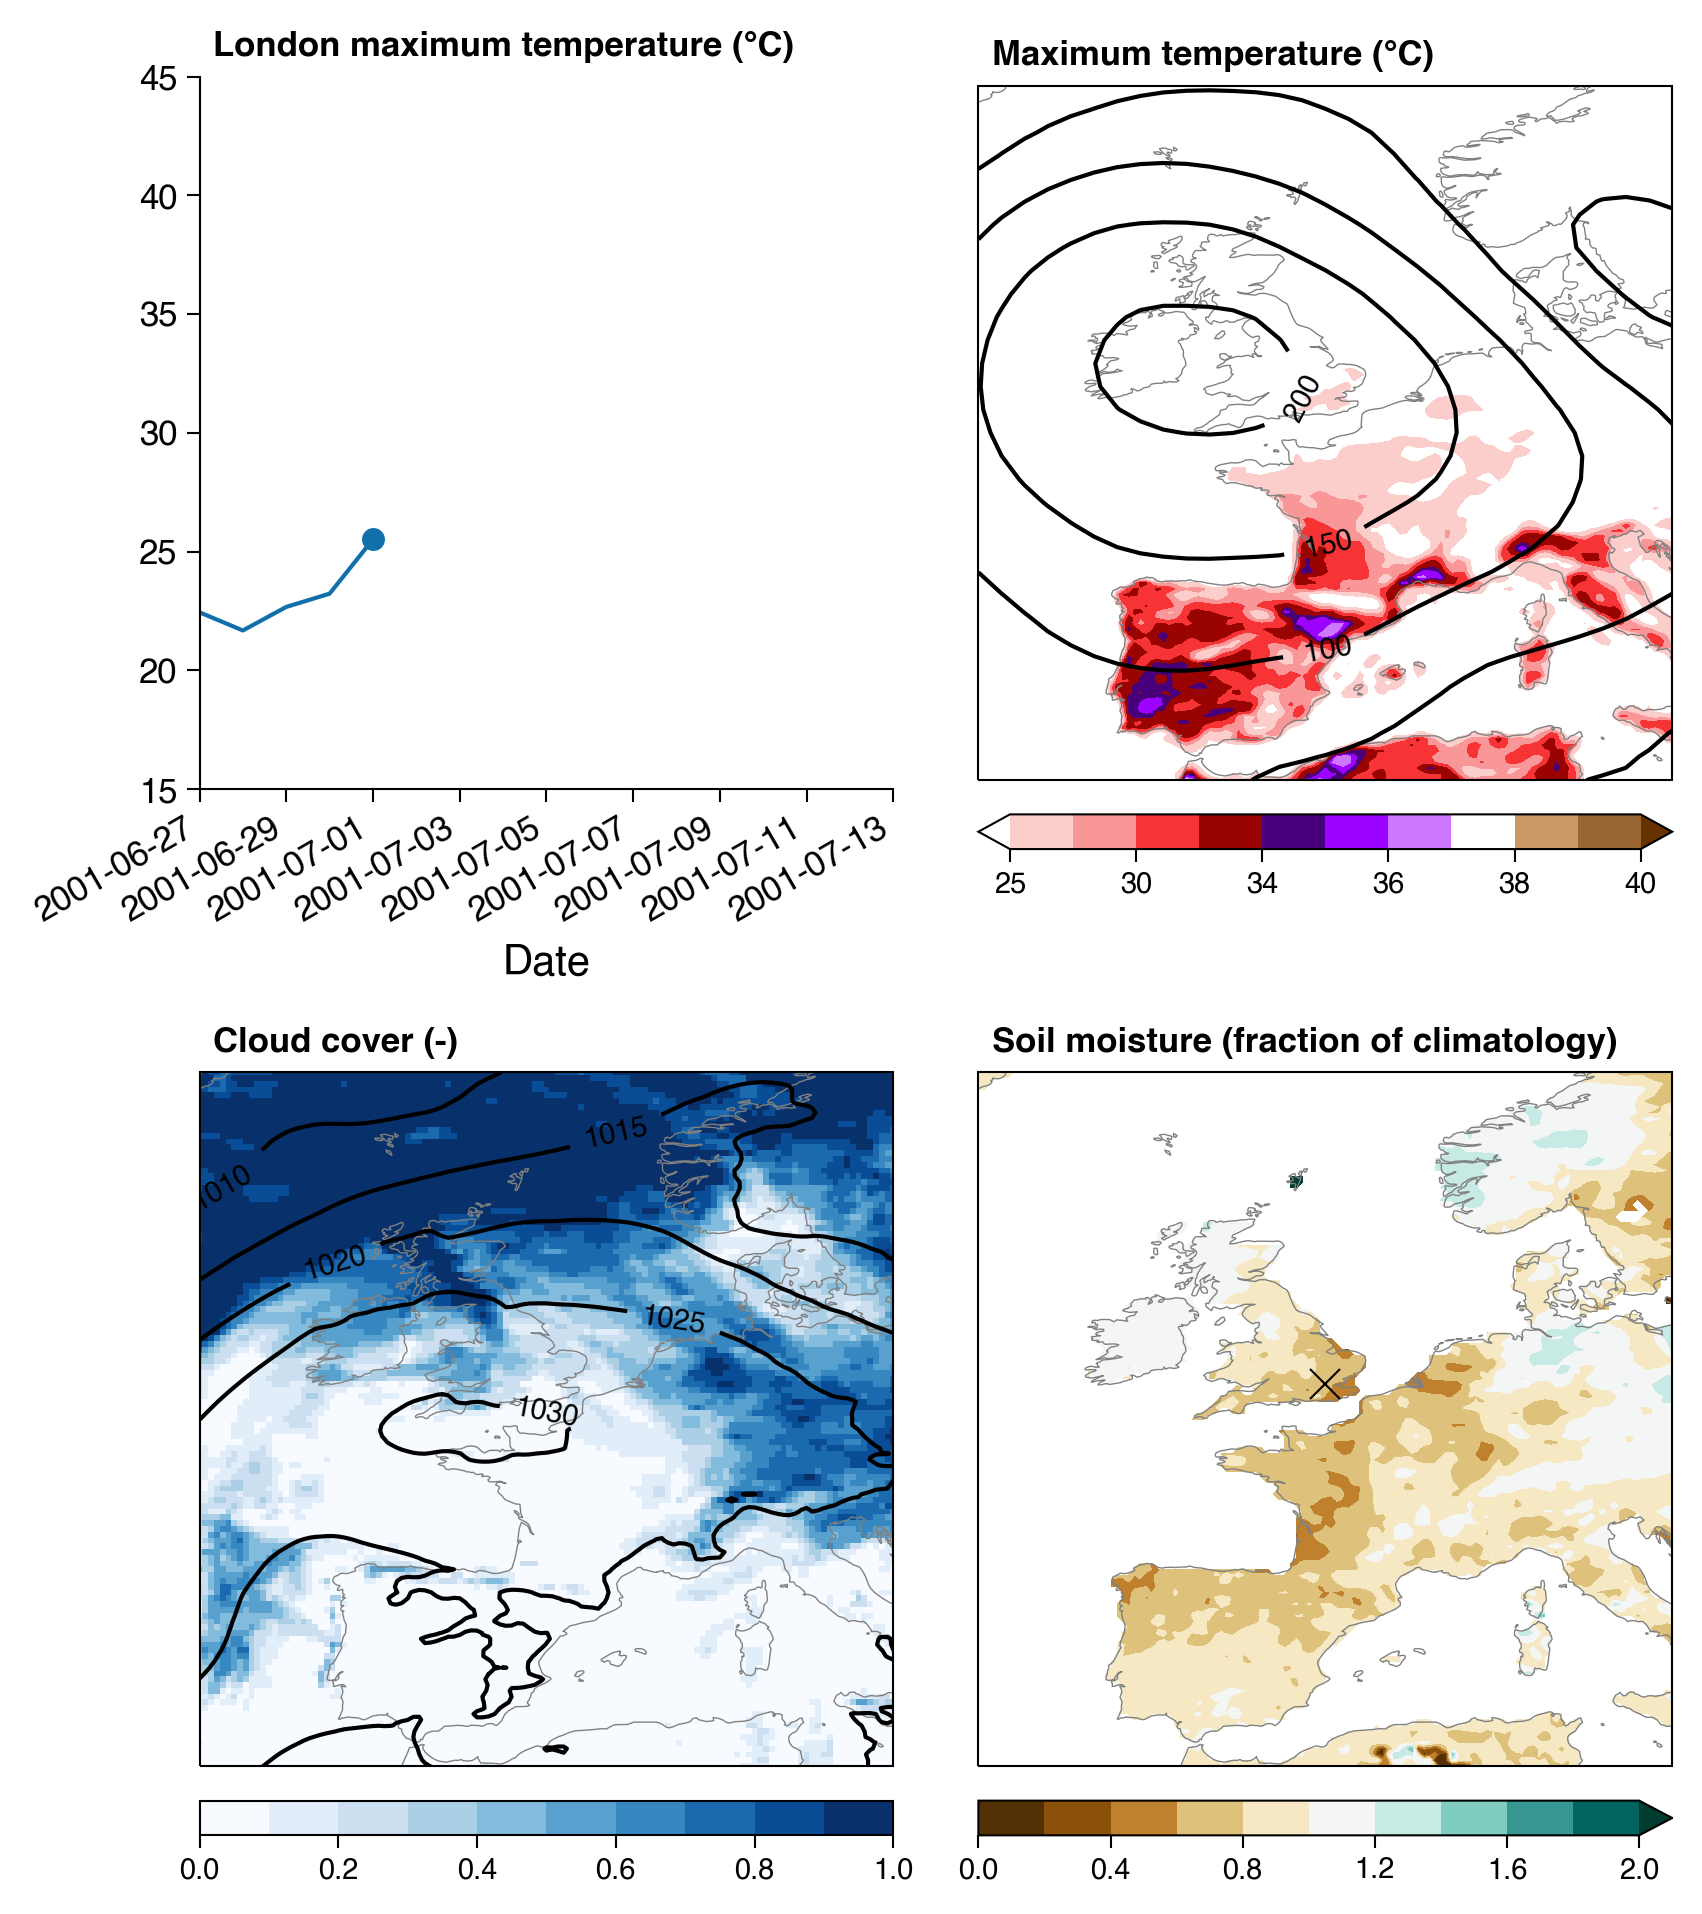
Top left, trajectory of daily maximum temperatures for gridbox in East London. Top right, map of daily maximum temperature (colorbar credit @ The Met Office) over Western Europe overlaid with contours of 500 hPa geopotential height anomaly. Bottom left, map of cloud cover fraction overlaid with mean sea level pressure. Bottom right, top layer soil moisture as fraction of 2001-2020 climatology. All the maps are means or maxima for the final day shown in the timeseries plot.
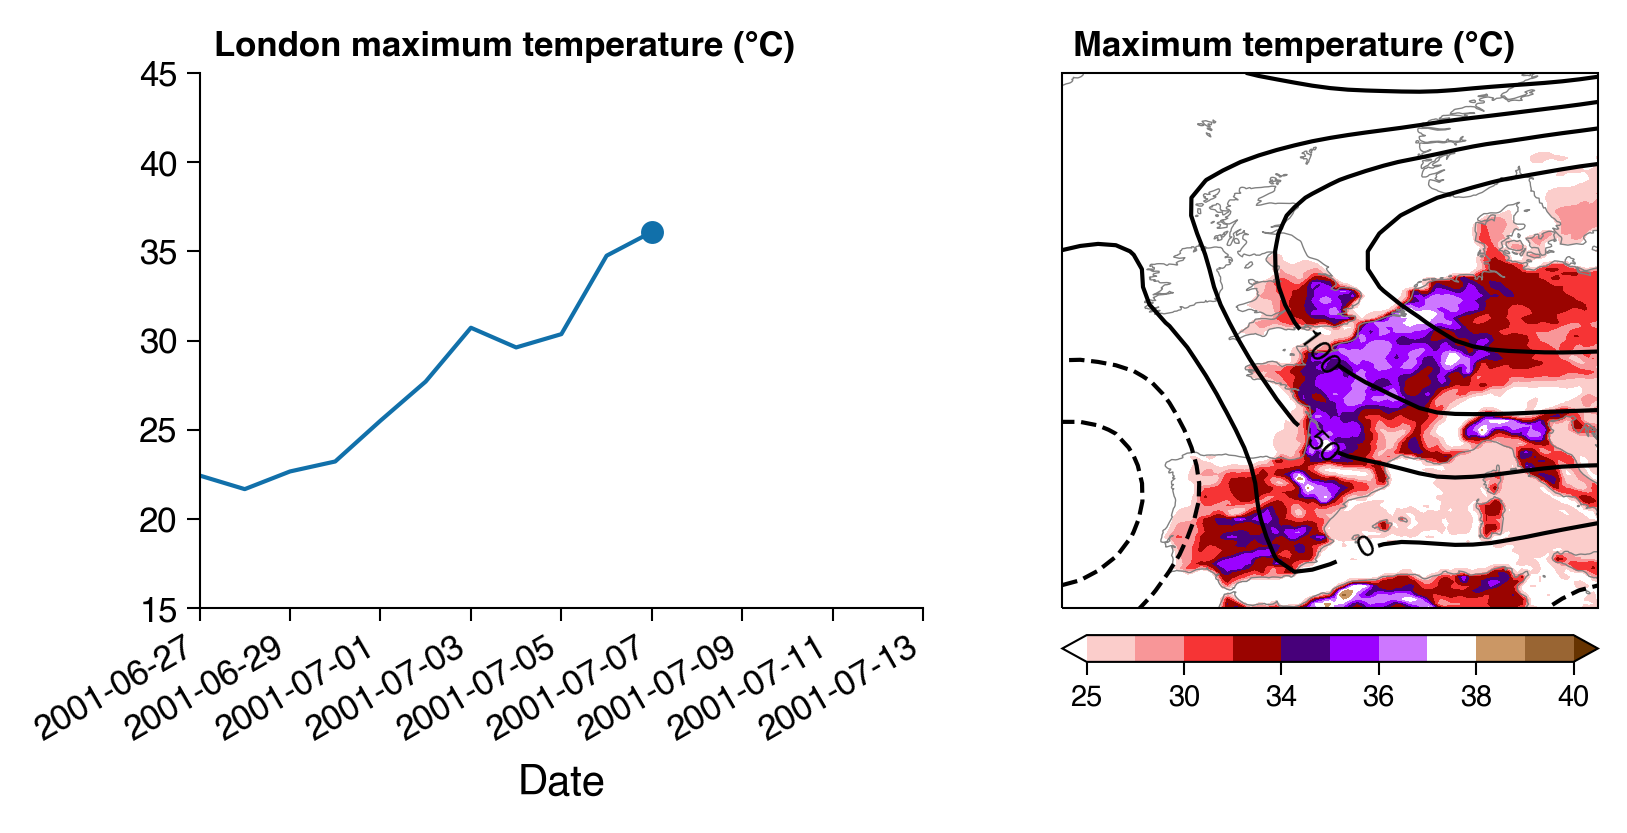
July 7, 2001*
Henman beats Goran Ivanišević in the semi-finals. The south of the UK has been in heatwave for around 5 days as a result of warmer air being advected up from the subtropics. The center of the dome has moved East, cloud cover over southern UK remains low, and soil moisture deficits deepen.
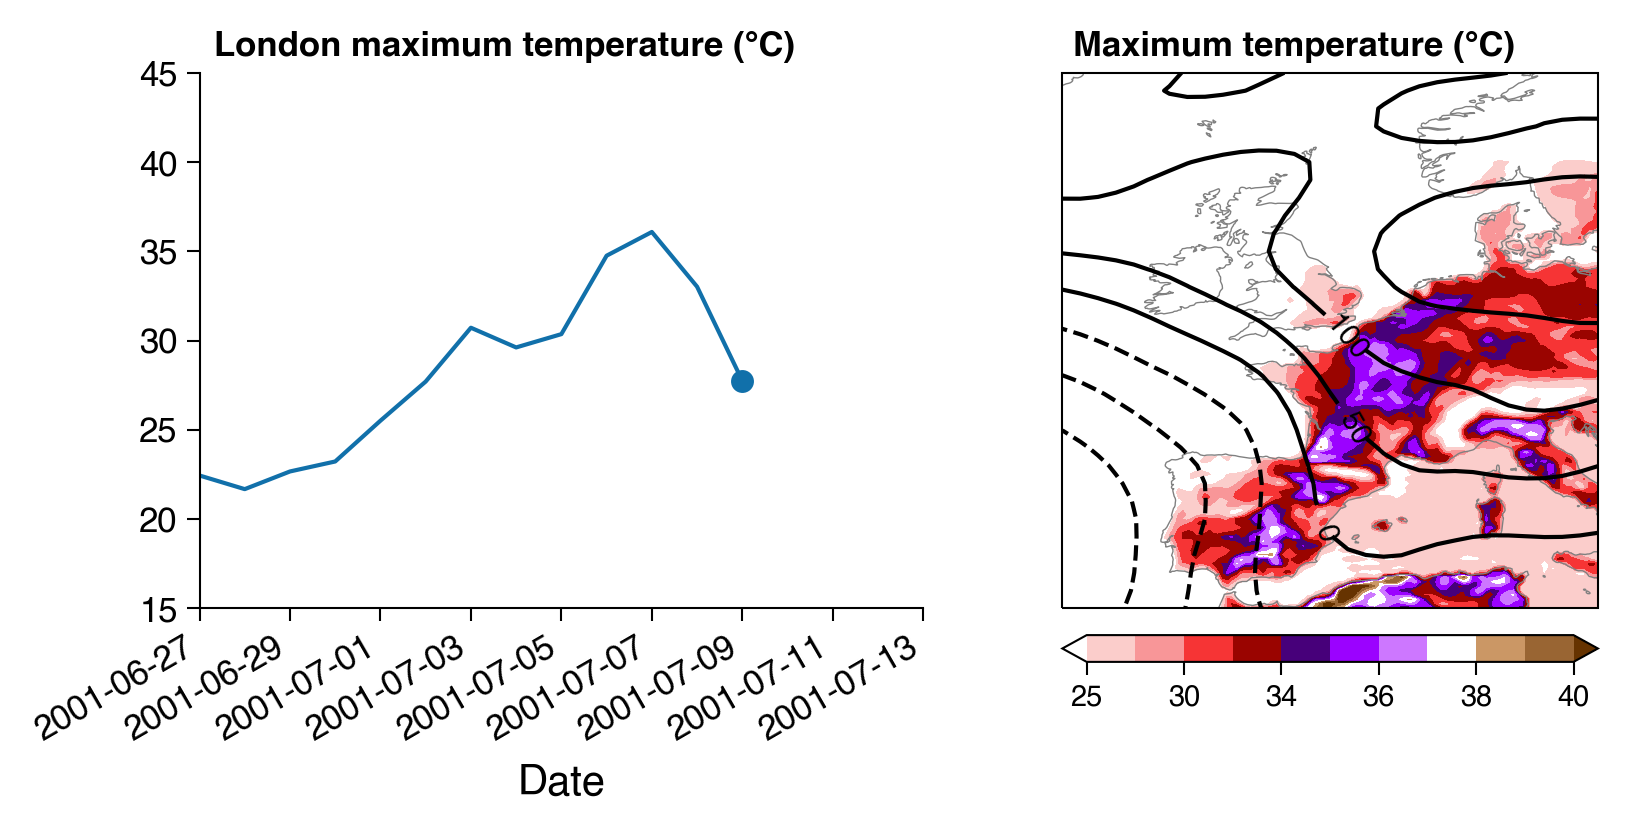
July 9, 2001*
Henman defeats Pat Rafter to win Wimbledon, becoming the first Brit in 65 years to do so. The heat over London has dropped as the dome moves sufficiently eastward, though still remains above average. Much of Central Europe is still experiencing temperatures in the high 30s. Some storms break over Spain and Portugal, reducing the soil moisture deficit there, but it remains exceptionally dry elsewhere.
July 11, 2001*
Temperatures rise again as the block returns to a center around Belgium. Much of France and Spain is now experiencing temperatures in excess of 40°C: for some areas it is the second day of such highs.
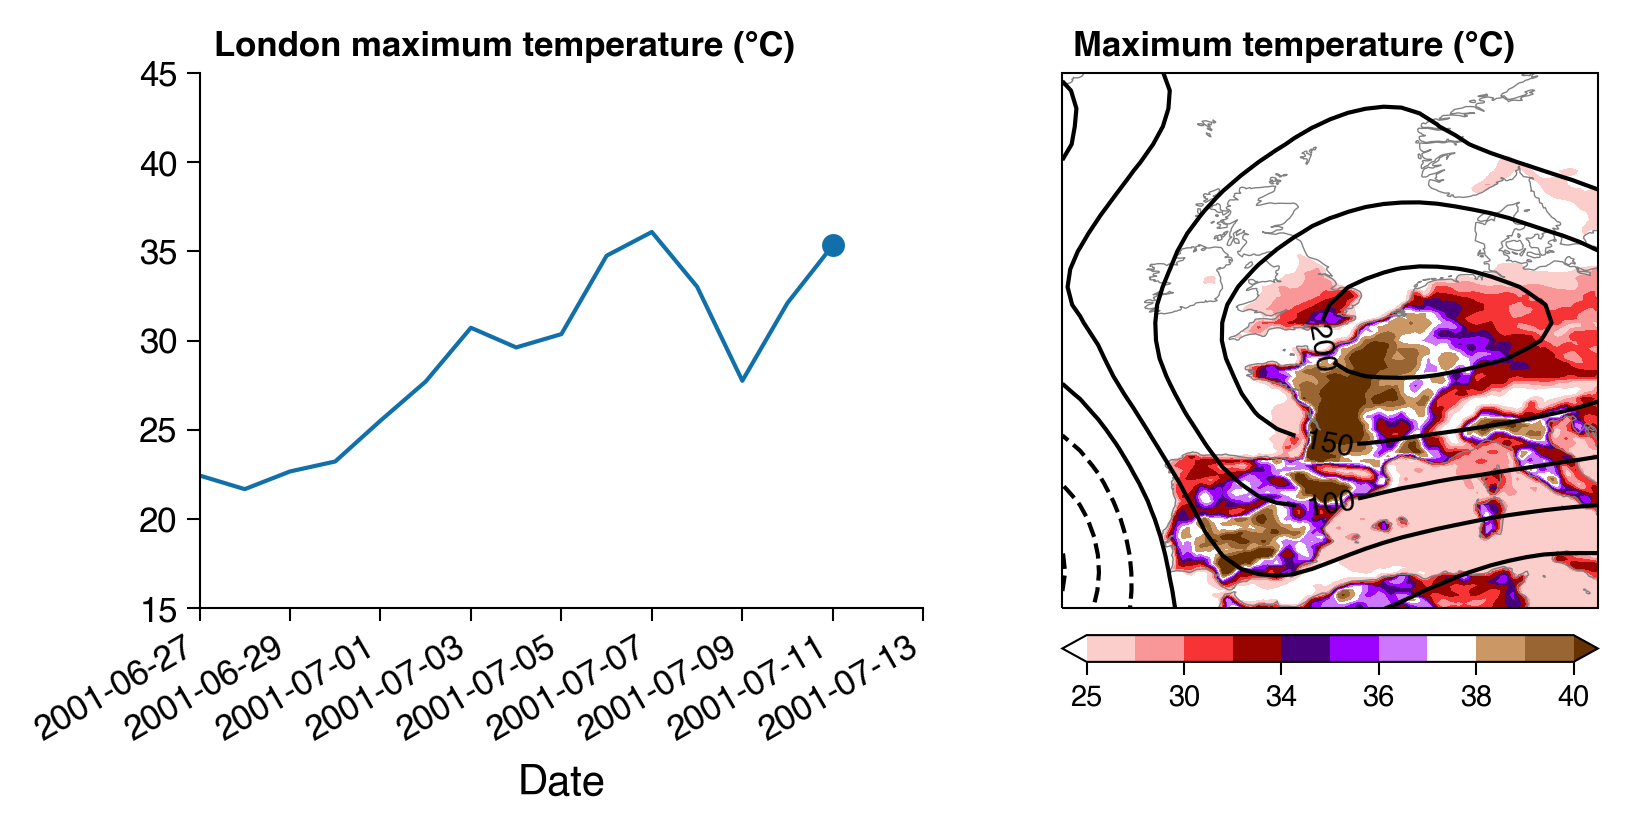
July 13, 2001*
Temperatures peak in London at 41°C in East London, breaking a record set 11 year previously by 4°C. Huge areas of France see temperatures over 40°C. The dome has remained stationary for a few days now.
The hot spell calms down by the 18th, but by then some places in France have seen temperatures in excess of 40°C for 7 days straight.
*This heatwave never happened (and Tim Henman sadly lost in the semi-final) - so what is this alternative reality I have described above?
This extreme weather occurred in a hindcast** that was run for the ECMWF ensemble prediction system back in 2019. Althoguh a few years ago now, the model version used back then isn’t hugely different from the current one: same horizontal resolution, with ocean coupling, but slightly reduced vertical resolution (91 vs. 137 levels). These hindcasts are run regularly, at ensembles of 220 members twice per week and used to calibrate the present forecasts and provide information about extremes.
The specific hindcast that this weather evolved in was run on 2019-06-27 and is one of the 11 members that started from the 2001 initial condition. I won’t go into specifics of the hindcasts here, but essentially if we believe that the EC model is a good representation of reality (which for this location is a reasonable assumption), then this exceptional heat, including a temperature of 40°C in the UK, could have plausibly happened back in 2001. Simon Lee has a great thread about this. However, such heat didn’t occur in any of the other 10 hindcast ensemble members nor in reality (we also don’t find anything like it in the actual forecasts from the time since they were only run out for 10 days back then!). What actually happened was the UK saw some moderate warm temperatures between the 1st & 5th of July, accompanied by some intense thunderstorms on the 3rd and 4th, but temperatures then reduced down to below average daily maxima at the bottom of the hindcast ensemble. This is shown below.
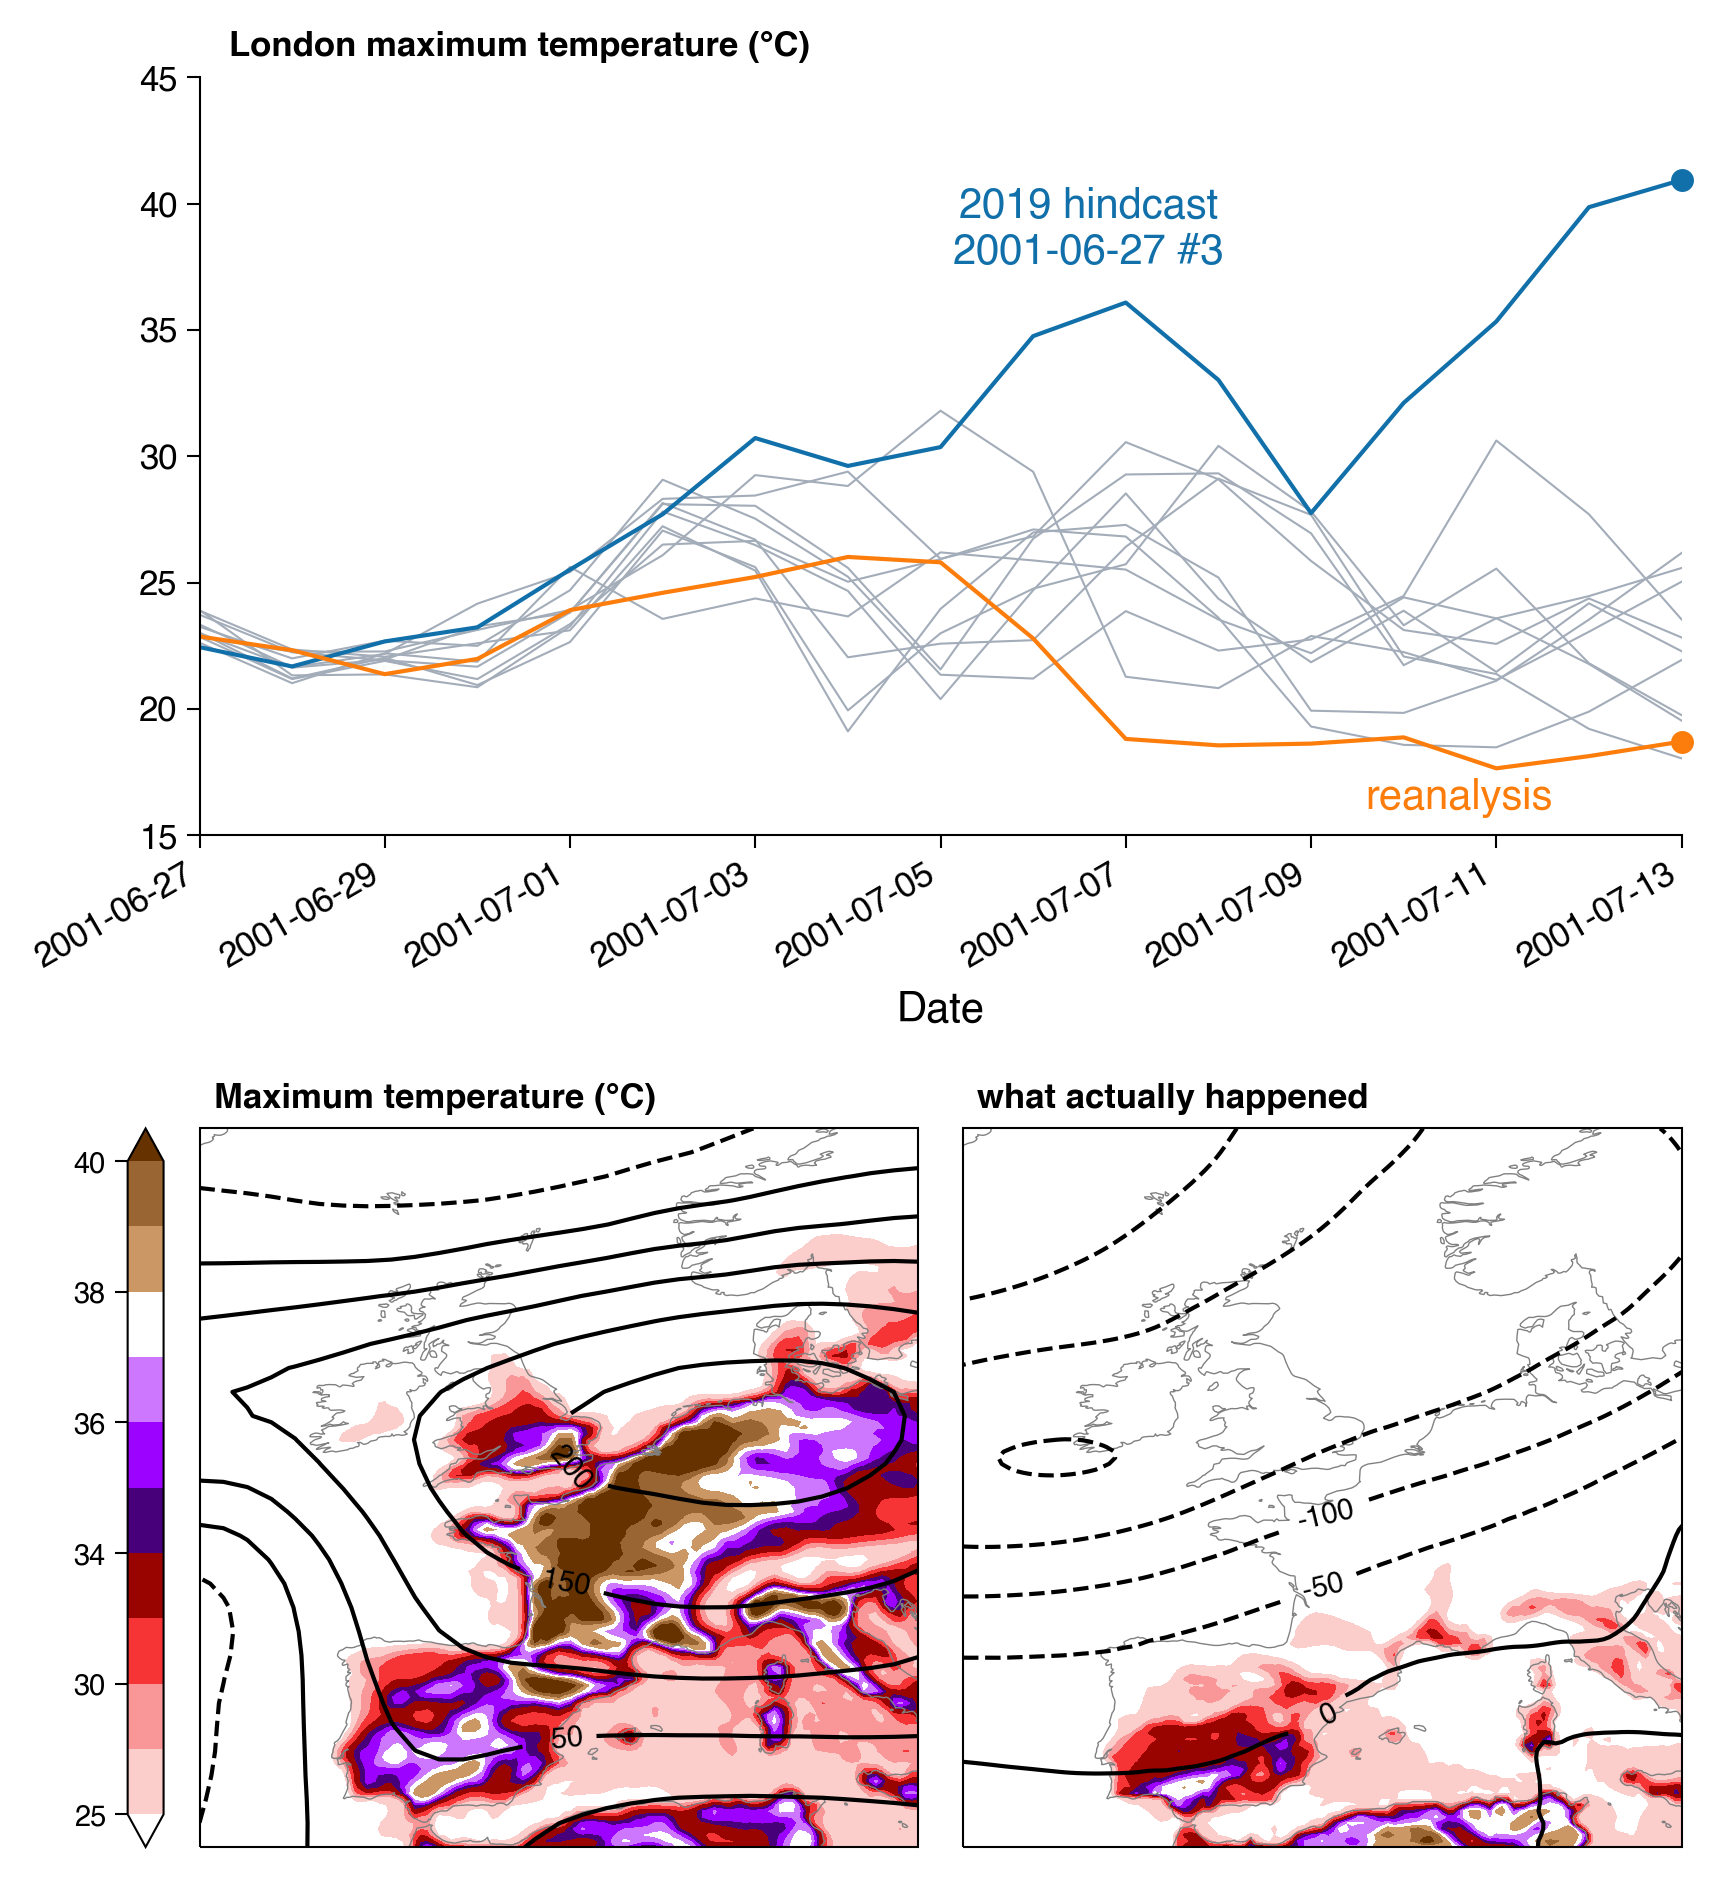
Top, trajectories now include other hindcast members as well as what actually happened based on ERA5. Bottom right, as above but based on reality (ERA5).
What’s the point of all this?
To recap - here we have a state-of-the-art forecast model that is unequivocally able to simulate the recent exceptional heat (temperatures in excess of 40°C in the UK), as demonstrated by its successful prediction at a lead of over a week. The same model simulated similarly exceptional temperatures during a hindcast run initialised using a state from 2001. Here it is worth emphasizing that this 2001 hindcast does not mean that such intense heat was likely back in 2001 - in fact it was probably incredibly unlikely - but it does mean that it could plausibly have happened. Another curiosity is that the development of the heatwave in this alternate 2001 reality is oddly similar to what happened last month in London, and was driven by similar synoptic features. They both feature a hot period, followed by a dip, before returning to the truly record-breaking temperatures. Both feature very low soil moisture and cloud cover, as well as a low off the coast of West Iberia pushing very warm air northward. Some similarity may not be particularly surprising given the similarity in outcome, but I think (admittedly based on very little quantitative analysis) that these are more than just a little similar.
Even though the not-2001 event was only 1°C warming than the 2022 one, it occurred in a world of around 0.5°C lower global warming. And local effects (or model biases) can mean that forecast models don’t quite reach the high temperatures observed by weather stations (eg. in the 2022 heatwave, ERA5 peaks at ~39°C, just under 1°C cooler than the hottest stations). Both of these features mean that if such an event were to occur in the present, it could end up with maximum temperatures 1-2°C higher than the 2022 event. It goes without saying that such an event would have severe impacts to human life, infrastructure, and the environment.
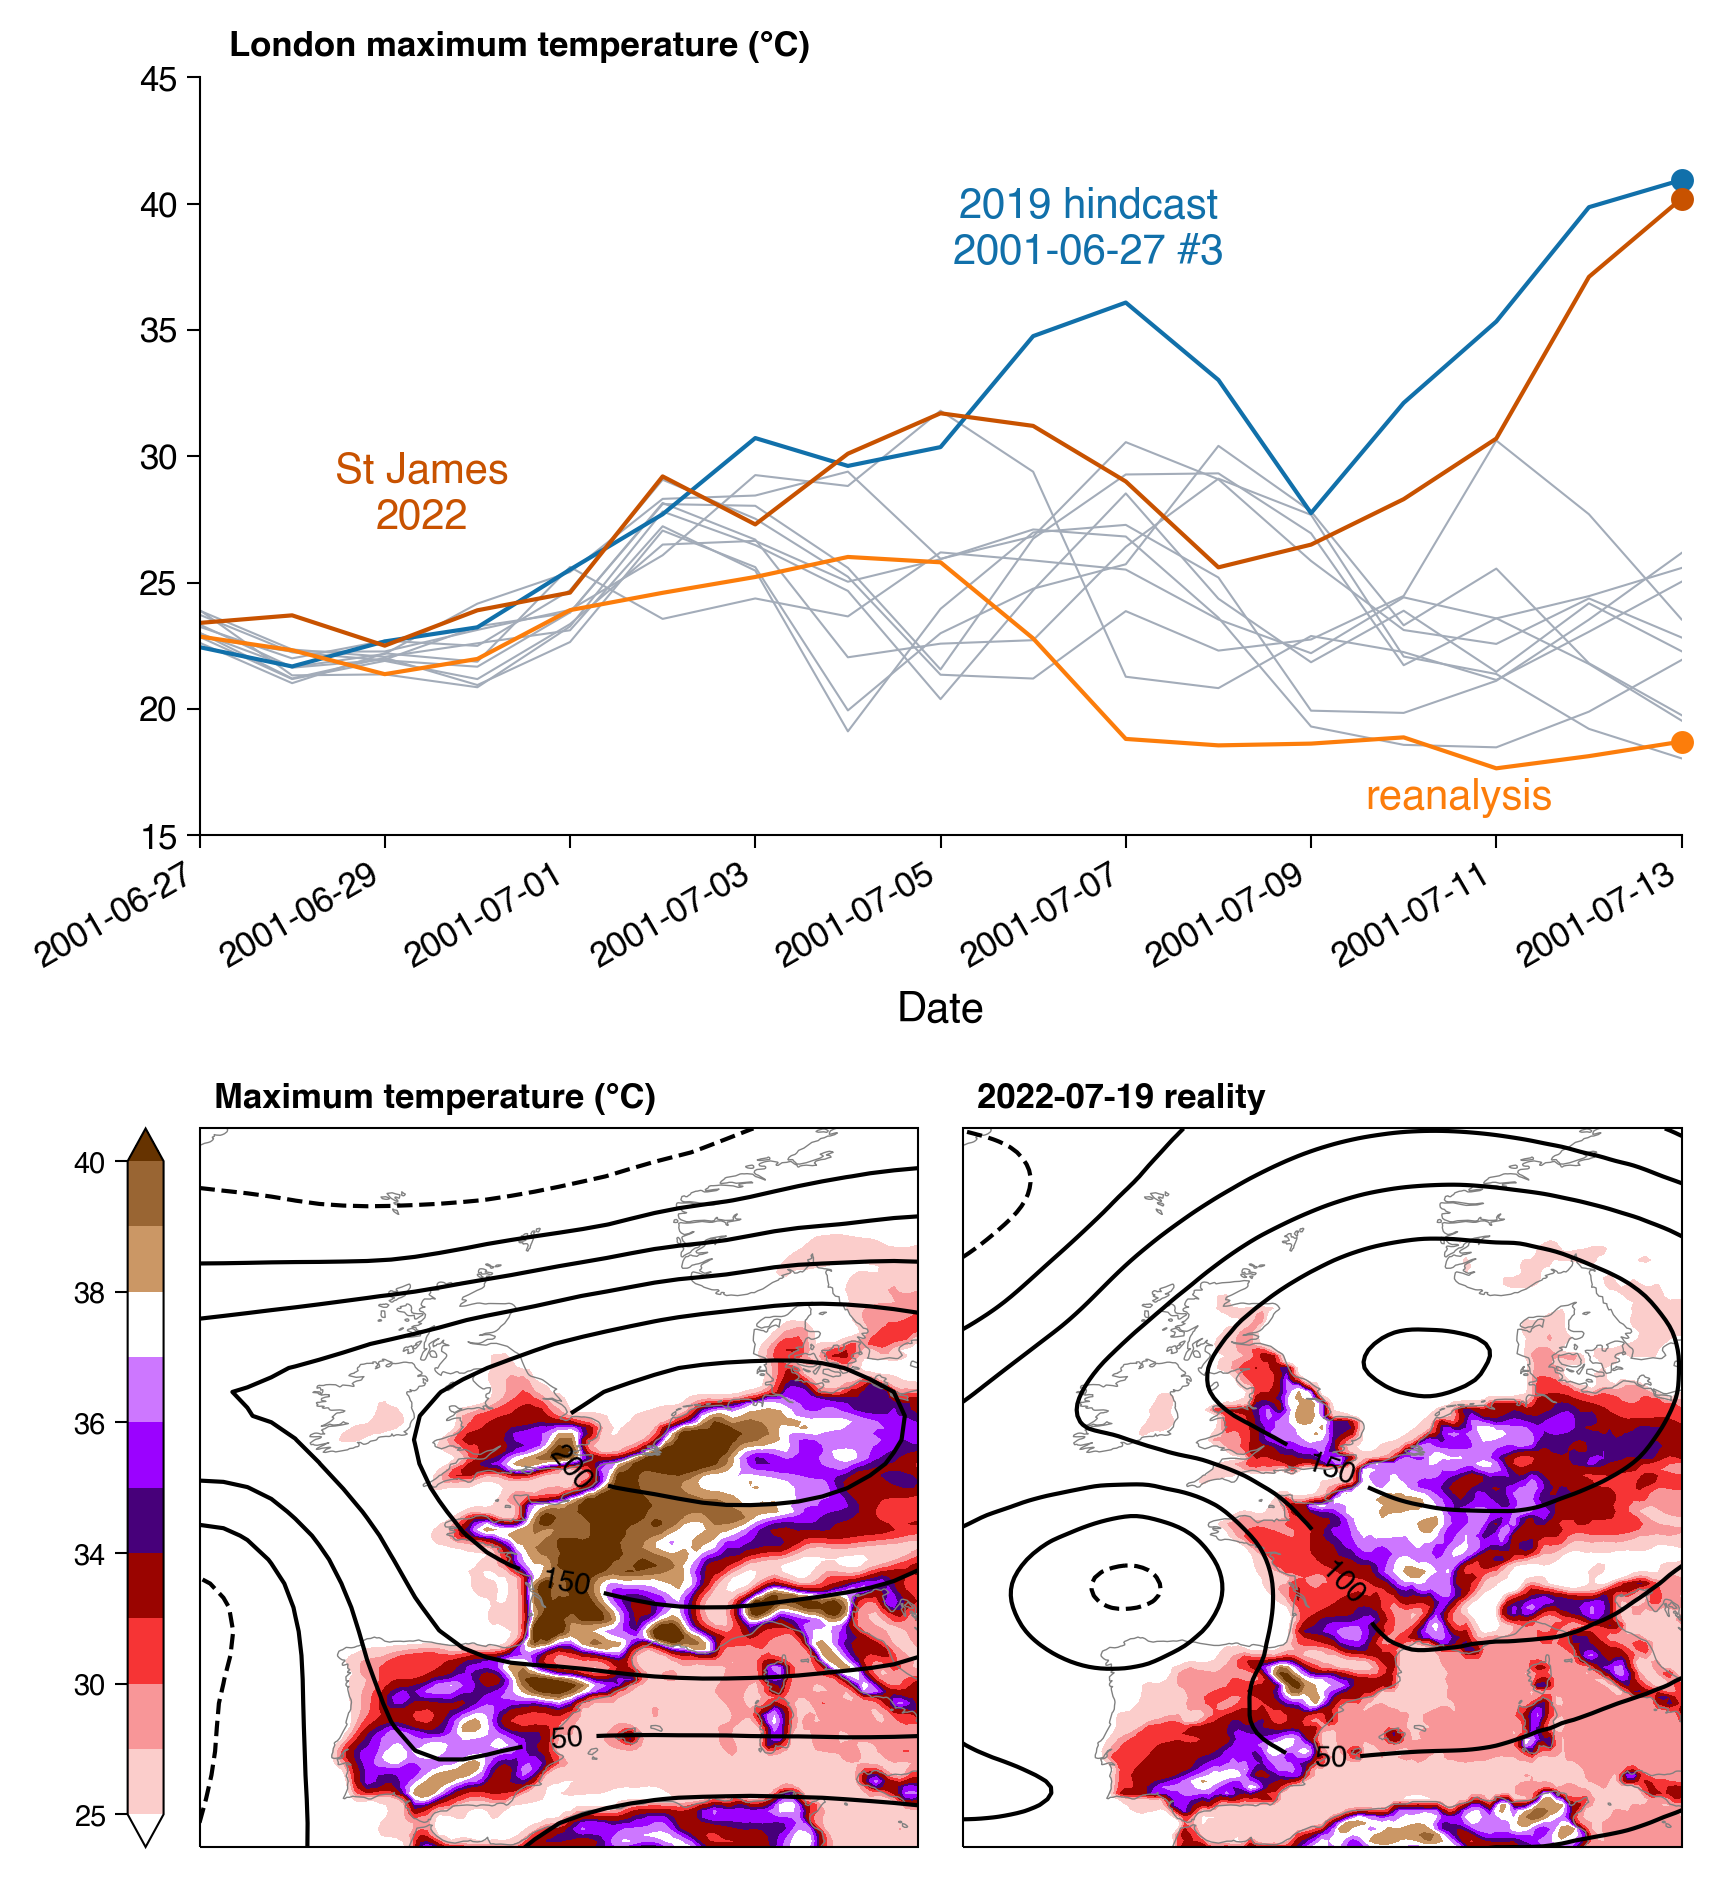
Top, trajectories now include the 2022 heatwave (from the weather station at St James Park in London), with the timing of the peak shifted to match up with the not-2001 event. Bottom right, as above but from the peak of the 2022 heatwave.
I’ll finally get to my point. We have these extremely high-resolution and well-validated models that we know are able to produce accurate representations of the weather (including extreme weather) for large areas of the world. They are designed to do this in a way that many (all?) climate models are not (where processes like drift become more important). There exists a huge number of hindcast simulations of the recent past that is used to calibrate these models. These hindcasts contain plausible realisations of what might have happened in the recent past. Could we not use these more for assessing the possible upper bounds of extreme weather and get a sense of what other “grey swans” we should prepare for in the coming years - not just for heatwaves, but other types of extreme? This has been done already using seasonal forecasts in the UNSEEN approach1, but I haven’t yet seen the (typically higher-resolution, and with generally fewer issues from model drift) medium-range hindcasts used in this way.
A couple of caveats that I should definitely mention - assessing the probability of such events from hindcast data is much trickier than (eg.) from large climate model ensembles. Hindcast ensemble members aren’t independent, nor are the hindcast ensembles from successive leads due to the existance of a predictable component of the weather. I do think it could be done with some work, but first you’d need to determine the true degrees of freedom in the ensemble. The second caveat is that the hindcast ensembles do not sample the full range of plausible weather, since they are only initialised from states that did actually happen. Hence although they might be able to give an indication of what extreme weather is plausible, it will always be possible that even more extreme weather could exist (and we just haven’t seen the right state for it to materialise). However, given that these hindcasts are run anyway, we may as well make use of the considerable information that they can provide despite these caveats.
**using hindcast interchangeably with re-forecast here
References
1 Thompson, V., Dunstone, N. J., Scaife, A. A., Smith, D. M., Slingo, J. M., Brown, S., & Belcher, S. E. (2017). High risk of unprecedented UK rainfall in the current climate. Nature Communications, 8(1), 1–6.